How to Guide & Quick Start
Introduction to Local Insights
Local Insights is a powerful, web-based platform that gives you access to over 300 hyperlocal data points for any address in the U.S. Our reports go beyond standard listing information, helping you evaluate crime, schools, amenities, demographics, housing, and more—all within a small, focused radius. Whether you're a real estate agent, homebuyer, renter, or investor, Local Insights helps you make smarter, faster, and more informed decisions.
Getting Started
To begin, simply create an account and log in to your dashboard. New users can start with a 7-day free trial, which provides access to the full range of features and unlimited searches. No downloads or installation required—Local Insights runs directly in your browser on desktop or mobile.
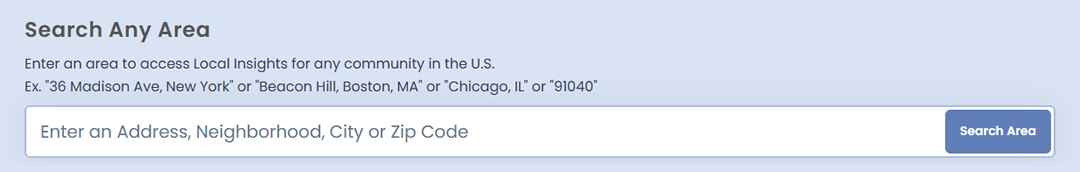
How to Generate a Report
Enter any address into the search bar and click “Search Area.” Within a few seconds, our platform scans and organizes data from multiple sources to create a clean, easy-to-read neighborhood report. Reports are typically generated in under 10 seconds, but may take slightly longer due to the large volume of data.
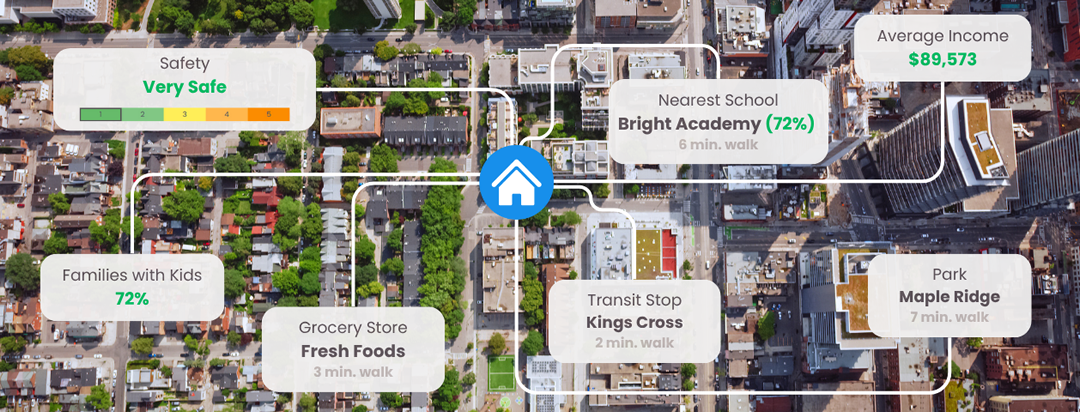
What’s Included in a Report
- Demographics (age, income, education, households, ethnicity)
- Local and City Crime Data*
- Housing and Economy
- Schools and Test Scores
- Transit, Commute, and Accessibility
- Nearby Amenities & Points of Interest
- Health & Safety Services
- And much more—all focused within a small radius.
*Location-specific crime data is available for larger cities. City-specific crime data represents approximately 309 million American residents, which results in 98% coverage of metropolitan statistical areas.
How to Read the Proximitii Scores
Each category in the report is assigned a Proximitii Score ranging from 1–10. Higher scores indicate stronger performance for that category. You’ll also see an overall Proximitii Score ranging from 1–100, which combines all categories into a single livability rating for the location.
Scores are calculated based on proximity, volume, and comparison to city-level averages for census-derived categories. Think of them as a simple way to compare neighborhoods at a glance.
Best Way to Use the Reports
For Homebuyers
- Get a snapshot of what it’s like to live in the area.
- Check demographics to see if the neighborhood aligns with your lifestyle.
- Review crime stats and school scores for family-friendliness.
- Use the Compare feature to evaluate multiple addresses side-by-side.
- See proximity to parks, restaurants, stores, and transit.
For Real Estate Professionals
- Generate branded reports for listings or client consultations.
- Add your branding for a professional, trust-building touch.
- Use scores to explain neighborhood strengths clearly.
- Share data-backed insights with clients to support your recommendations.
- Send reports post-showing to stay top-of-mind.
For Investors
- Evaluate neighborhood stability through ownership and vacancy data.
- Understand renter demographics and potential tenant demand.
- Review home values, rent burdens, and economic trends.
- Identify proximity to high-value infrastructure and amenities.
- Analyze crime data to manage investment risk.
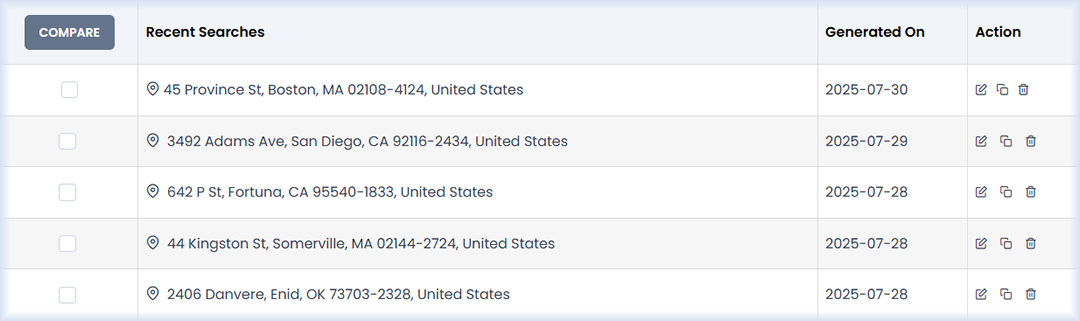
Comparing Addresses Side-by-Side
From your dashboard, select multiple saved addresses and click “Compare.” You'll see a side-by-side breakdown of each address’s Proximitii Score and category ratings—ideal for buyers, agents, or investors making close calls.
Customizing & Branding Your Reports
From your profile settings, you can upload:
- Your name and photo
- Contact info
- Team or company logo
- Social media links and website
Branded reports build trust and reinforce your professional image with every share.
Sharing & Saving Reports
- Share via direct link
- Download as a PDF
- Print clean, client-ready versions
- All reports are saved to your dashboard for easy access at a later time
Managing Your Subscription
- Update profile or preferences
- Cancel or modify your plan at any time—no hidden fees
- View billing history, receipts, and invoices
Tips to Get the Most Out of It
- Run reports early to narrow down your search
- Compare 2–3 locations side-by-side to see differences
- Use scores to set search priorities like schools or walkability
- Validate data during real-world neighborhood visits
- Bring your report to ask smarter questions
- Refresh reports before making final decisions
- Zoom in on demographics to align with your needs
- Justify offers or pricing with data-backed insights
- Use branding to leave a lasting impression
Troubleshooting & Support
- No Scores or Data: May be due to limited availability in the selected area.
- Slow Report Loading: Processing 50M+ data points may take 10+ seconds.
- Can’t Access Reports: Make sure you're logged in with the right email.
- Branding Not Showing: Confirm your profile is complete and branding is enabled.
- Download/Share Issues: Disable pop-up blockers or switch browsers.
- Forgot Password: Use the Forgot Password link to reset your password.
- Need Help? Contact Support.